Historic Carousel at Chase Palm Park in Santa Barbara Closed First Week of December 2017

ChasePalm3.jpg

The historic 1916 Allan Herschell Carousel has operated at Chase Palm Park in Santa Barbara since 1999. Nearing the end of its 20 year lease with the City of Santa Barbara, the owner of the Carousel opted to relocate it Hood River, Oregon, for installation in a dedicated museum of historically significant carousels.

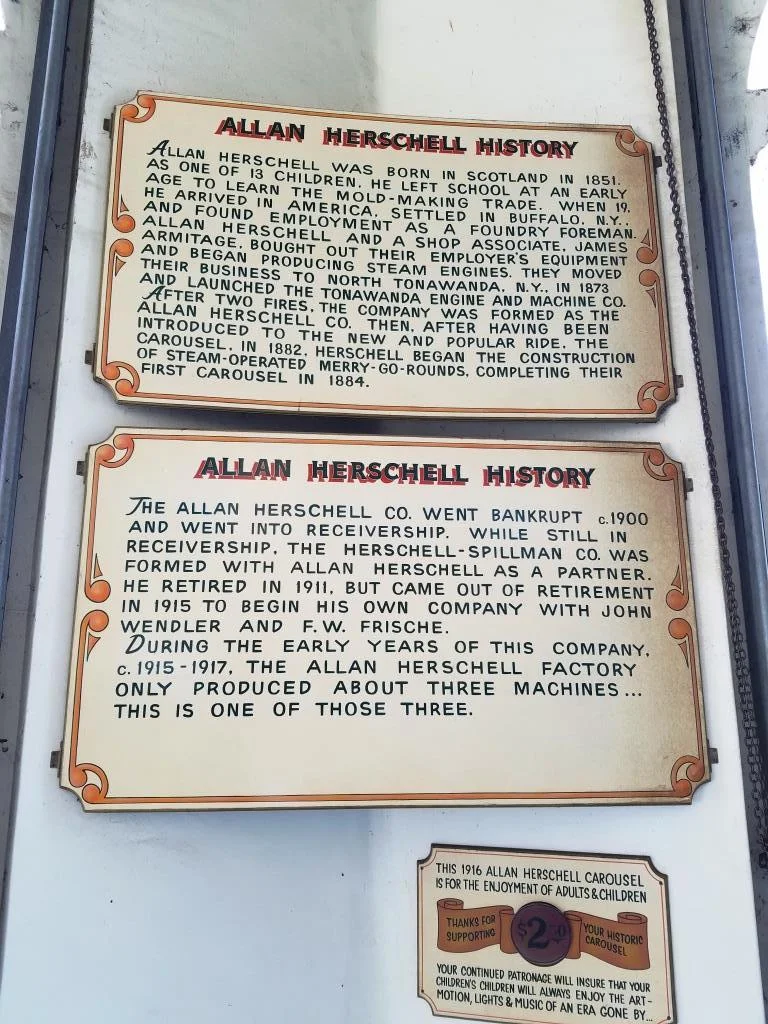
The Carousel is one of three machines produced by the Allan Herschell Factory in the 1915-1917 time frame. It was listed in the National Register of Historic Places on April 13, 2000. It is 40 feet in diameter, with a 19 foot wooden pole in its center, supporting 35 jumping, hand-carved wooden horses plus two hand carved art deco style wooden chariots.

This carousel originally operated outdoors on the east coast, where it was used for decades without adequate maintenance. It was purchased in 1970 by Seaport Village in San Diego, where after 10 years in storage it was sold again to its current owners. 

While this is sad news for local residents, the good news is that this historical carousel will be preserved in its new location in Hood River. 

herschell.jpg

The Libbey Community Playground at Libbey Park in Ojai

The Libbey Community Playground was built and completed by volunteers in October 2015. 

The community also provided input into the design of the playground, which is one of the coolest playgrounds for young kids in Ventura County now from my vantage point. Over 500 people volunteered for the project and numerous local organizations provided supplies. Amazingly, this beautiful playground was built in only six days!

LibbeyPlayground3.JPG

The most prominent feature of the playgrounds is a large wooden fort-like structure with treehouse, rock wall, slides, climbing rock, monkey bards, maze, fire pole, swings and many other features. The park has sections geared towards ages 2 to 5 and 5 to 12.

Quad Pod Spinner at Libbey Playground

Quad Pod Spinner at Libbey Playground

The park also has a unique looking "quad pod spinner," a newer, what looks to be safer, version of the traditional "spin around in circles" playground equipment many of us remember from our youth. 

And one other feature is the "Turf Hill," a small sliding hill, similar to the "Ant Hill" at Thousand Oaks Community Park.

If you are in Ojai with young kids, well this is an obvious "must do" attraction. Libbey Park is located in the heart of Ojai, the smallest city in Ventura County in terms of population.

Libbey Park is adjacent to Libbey Bowl, which hosts a number of concerts and events year-round.

THINGS TO DO IN OJAI

The Turf Hill at Libbey Community Playground

The Turf Hill at Libbey Community Playground

California Minimum Wages Increase Again on January 1, 2018

minimumwage.jpg

Pursuant to California Senate Bill No. 3 signed by Governor Jerry Brown in April 2016, on January 1, 2018, the California minimum wage increases from $10.50 to $11 per hour for employers with 26+ employees and from $10 to $10.50 for employers with 25 or less employees (with the exception of California sheepherders...which you can read about more HERE).

The overall target of the legislation is $15 per hour for all employees by January 1, 2023 (companies with 26+ will get there by January 1, 2022; one year earlier than smaller companies).

Future Minimum Wage Increases for Employers with 26+ Employees:

  • 1/1/19: $12/hour
  • 1/1/20: $13/hour
  • 1/1/21: $14/hour
  • 1/1/22 until adjusted again: $15/hour

If your employer has 25 or fewer employees, there will be a year lag in the increases highlighted above.

  • 1/1/19: $11/hour
  • 1/1/20: $12/hour
  • 1/1/21: $13/hour
  • 1/1/22: $14/hour
  • 1/1/23: $15/hour

So, if you are a minimum wage employee at a smaller company, you will be making slightly less than your "larger" company counterparts in California until 1/1/23.

After 2022, the minimum wage will generally be increased by the lesser of 3.5% or the annual inflation rate.

More on California minimum wages at www.dir.ca.gov/dlse/faq_minimumwage.htm.

But WAIT!

If you are a minimum wage employee in the City of Los Angeles, different rules apply:

Employers with 26+ Employees in City of Los Angeles:

  • 7/1/17 to 6/30/18: $12/hour
  • 7/1/18 to 6/30/19: $13.25/hour
  • 7/1/19 to 6/30/20: $14.25/hour
  • 7/1/20: $15/hour

Employers with 25 or Fewer Employees in City of Los Angeles (or 26+ Employees with approval to pay a deferred rate):

  • 7/1/17 to 6/30/18: $10.50/hour
  • 7/1/18 to 6/30/19: $12/hour
  • 7/1/19 to 6/30/20: $13.25/hour
  • 7/1/20 to 6/30/21: $14.25/hour
  • 7/1/21: $15/hour

More on L.A. City minimum wage laws at wagesla.lacity.org.

And of course, there's the irrelevant (at least to the majority of, but not all, states) Federal Fair Minimum Wage Act of 2007, which established the now current Federal minimum wage at $7.25/hour as of July 24, 2009.

Where to Volunteer to Decorate a Rose Parade Float

RoseParade2016_5.JPG

During winter break, many parents struggle to find something new and different to do with the kids. Something you may not have thought about is - volunteering to help decorate a Rose Parade entry! Talk about a unique experience!

As you are probably aware, Rose Parade floats must be completely covered by flowers and other natural materials, such as leaves, seeds and bark. It's a lot of work decorating those masterpieces! 

So how do you go about volunteering? Start with this list of commercial float builders and organizations that build their own floats for volunteer opportunities. The minimum age is generally 12 or 13 and you must sign a waiver.

Commercial Float Builders:

Self-Built Float Organizations:

View From Grant Park in Ventura and Serra Cross in January 1956

Panoramic view from Grant Park in Ventura in three photos taken in January 1956.

Panoramic view from Grant Park in Ventura in three photos taken in January 1956.

Here's a panoramic view from Grant Park in Ventura taken in January 1956. Shortly after Father Junipero Serra founded Mission San Buenaventura, a large wooden cross was placed on top of the hill overlooking the Mission church.

The original cross, damaged over time by the elements, was replaced in the 1860s. That cross blew down in a storm on November 5, 1875 and was not replaced for 40 years.

The cross at Grant Park / Serra Cross Park in 2015.

The cross at Grant Park / Serra Cross Park in 2015.

A new wooden cross was placed by a local women's service club on September 9, 1912. In 1918, Kenneth and Tonie Grant donated the surrounding hillside to the City of San Buenaventura. Roads to the cross were built around 1920. The circular stone pedestal and concrete pathway the cross now sits atop was built in March 1932. The cross that sits there today, a bit charred from the Thomas Fire, was replaced by the city in 1941.

The Serra Cross Conservancy is seeking donations at www.gofundme.com/serracrosshelp to help restore the cross and surrounding property.

Serra Cross in January 1956, from a private collection.

Serra Cross in January 1956, from a private collection.

Thomas Fire Grows to 2nd Largest Fire in California History and is 55% Contained

UPDATE: Since this post, the fire grew to burn a total of 281,893 acres (440 square miles), making it the largest wildfire in modern California history (which was subsequently surpassed by the Mendocino Complex Fire of 2018, which burned a total of 459,123 acres).

The Thomas Fire has now burned 272,000 acres, making it the 2nd largest wildfire in California since accurate records of fires were maintained in 1932. Only the 2003 Cedar Fire in San Diego County was larger, at least as of tonight, at 273,246 acres. 

Cal Fire anticipates the Thomas Fire to continue burning until full containment is achieved by January 7th. That would mean the fire is expected to burn continuously for 34 days. As of tonight the Thomas Fire was 55% contained.

Areas of particular focus by firefighters are Montecito, Rose Valley and Fillmore. The area between Fillmore and Ventura along Highway 126 will remain in patrol status.

The Thomas Fire originated in Santa Paula the night of December 4th near county-managed Steckel Park, the Ventura Ranch KOA and Thomas Aquinas College (which the fire was named after).

The main store and cabins at the KOA were destroyed but much of the campgrounds is intact. Management indicates they will be rebuilding, with a goal of re-opening in the Spring.

The college did not sustain serious damage thanks to the efforts of firefighters, though there will still be extensive recovery costs. President McLean provides more information in the video below. Donations to help the school in its recovery efforts are accepted at thomasaquinas.edu/news/help-us-recover.

Thousand Oaks and Simi Valley Had the 7th and 9th Lowest Crime Rates Among Large Cities in 2016

In late September 2017, the FBI released its annual Uniform Crime Reporting (UCR) data for 2015. "Crime in the United States, 2016" compiles crime data from law enforcement agencies throughout the United States. The data includes violent crimes, consisting of murder, forcible rape, robbery and aggravated assault, and property crimes such as burglaries and thefts.

The overall U.S. violent crime rate grew 4.1% in 2016 (to 3.86 violent crimes per 1,000 inhabitants), the 2nd year in a row the rate increased. Overall property crimes declined 1.3% in 2016 (to 24.51 crimes per 1,000 inhabitants), the 14th year in a row the rate has dropped.

Four years ago, the crime rates were 3.87 (violent crimes) and 28.59 (property crimes).

We took a look at the data for approximately 300 cities in the U.S. with populations of 100,000 or more. The cities of Simi Valley and Thousand Oaks ranked 7th and 9th in the U.S (compared to 5th and 4th, respectively in 2015). and 1st and 2nd in California for the lowest overall crime rates among large cities in 2016. The top 10 lowest overall are shown in the table below:

Top ten lowest overall crime rates per 1,000 inhabitants in 2016; cities with population of 100,000 or more (Source: FBI Uniform Crime Reporting Data).

Top ten lowest overall crime rates per 1,000 inhabitants in 2016; cities with population of 100,000 or more (Source: FBI Uniform Crime Reporting Data).

Simi Valley's rate increased from 13.23 in 2015 to 13.67 in 2016 while Thousand Oaks' rate increased from 13.23 to 14.25.

Taking a look at solely violent crimes (murder, rape, robbery, assault), Thousand Oaks and Simi Valley dropped to 20th (12th in 2015) and 23rd (26th in 2015), respectively.

Top 10 lowest crime rates per 1,000 inhabitants in 2016; cities with population of 100,000 or more (Source: FBI Uniform Crime Reporting Data).

Top 10 lowest crime rates per 1,000 inhabitants in 2016; cities with population of 100,000 or more (Source: FBI Uniform Crime Reporting Data).

Let's take a look at other Ventura County cities of all sizes to see where they stand.

Overall crime rates per 1,000 inhabitants in Ventura County and adjacent cities in 2016 (Source: FBI Uniform Crime Reporting Data.) (Excludes unincorporated communities.)

Overall crime rates per 1,000 inhabitants in Ventura County and adjacent cities in 2016 (Source: FBI Uniform Crime Reporting Data.) (Excludes unincorporated communities.)

All Ventura County cities, with the exception of Oxnard and Ventura, fell below national averages for both violent and property crime rates in 2016.

The crime rates for most all Ventura County cities dropped in 2016 vs 2015, with the exception of Thousand Oaks and Simi Valley. 

Note: The FBI cautions comparative use of this data for drawing conclusions by making direct comparisons between cities. Comparisons lead to simplistic and/or incomplete analyses that often create misleading perceptions adversely affecting communities and their residents. Keep this in mind when reviewing this data, which is summed up here for informational purposes only.