
Thousand Oaks and Simi Valley Had the 7th and 9th Lowest Crime Rates Among Large Cities in 2016
/In late September 2017, the FBI released its annual Uniform Crime Reporting (UCR) data for 2015. "Crime in the United States, 2016" compiles crime data from law enforcement agencies throughout the United States. The data includes violent crimes, consisting of murder, forcible rape, robbery and aggravated assault, and property crimes such as burglaries and thefts.
The overall U.S. violent crime rate grew 4.1% in 2016 (to 3.86 violent crimes per 1,000 inhabitants), the 2nd year in a row the rate increased. Overall property crimes declined 1.3% in 2016 (to 24.51 crimes per 1,000 inhabitants), the 14th year in a row the rate has dropped.
Four years ago, the crime rates were 3.87 (violent crimes) and 28.59 (property crimes).
We took a look at the data for approximately 300 cities in the U.S. with populations of 100,000 or more. The cities of Simi Valley and Thousand Oaks ranked 7th and 9th in the U.S (compared to 5th and 4th, respectively in 2015). and 1st and 2nd in California for the lowest overall crime rates among large cities in 2016. The top 10 lowest overall are shown in the table below:

Top ten lowest overall crime rates per 1,000 inhabitants in 2016; cities with population of 100,000 or more (Source: FBI Uniform Crime Reporting Data).
Simi Valley's rate increased from 13.23 in 2015 to 13.67 in 2016 while Thousand Oaks' rate increased from 13.23 to 14.25.
Taking a look at solely violent crimes (murder, rape, robbery, assault), Thousand Oaks and Simi Valley dropped to 20th (12th in 2015) and 23rd (26th in 2015), respectively.

Top 10 lowest crime rates per 1,000 inhabitants in 2016; cities with population of 100,000 or more (Source: FBI Uniform Crime Reporting Data).
Let's take a look at other Ventura County cities of all sizes to see where they stand.
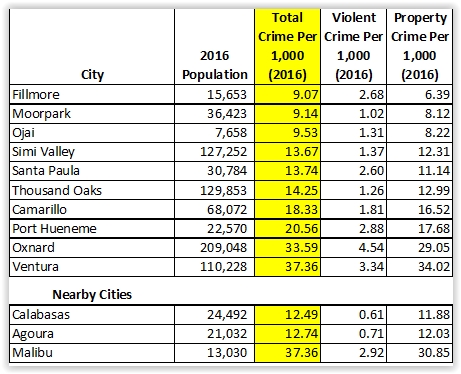
Overall crime rates per 1,000 inhabitants in Ventura County and adjacent cities in 2016 (Source: FBI Uniform Crime Reporting Data.) (Excludes unincorporated communities.)
All Ventura County cities, with the exception of Oxnard and Ventura, fell below national averages for both violent and property crime rates in 2016.
The crime rates for most all Ventura County cities dropped in 2016 vs 2015, with the exception of Thousand Oaks and Simi Valley.
Note: The FBI cautions comparative use of this data for drawing conclusions by making direct comparisons between cities. Comparisons lead to simplistic and/or incomplete analyses that often create misleading perceptions adversely affecting communities and their residents. Keep this in mind when reviewing this data, which is summed up here for informational purposes only.